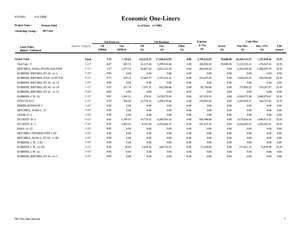
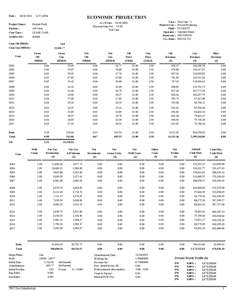
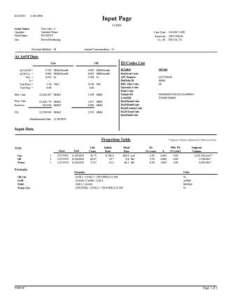
PHDWin is a full-featured, completely integrated economics and decline curve software package written by petroleum engineers for the oil and gas industry. It offers a complete solution to manage, organize, and evaluate reserves and economics.
Economics
Flexible modeling available for almost any country including U.S., Canadian and international assets. Before and after tax calculations are included. Cases can be projected in any volume convention and economics reported in the volume and currency convention of choice.
- Advanced modeling for prices, expenses, taxes and royalties
- Link to common price, expense, tax or royalty models
- Sophisticated ownership modeling
- Automated group reversions
- Multiple ownership decks
- Advanced reporting for combining ownership at report time
- Create custom product, revenue, expense and tax streams
- Investment grouping and tracking for capital budgeting
Group calculations affecting multiple cases like those associated with units and platforms have never been easier. PHDWin has the most advanced, automated and representative group modeling that previously had to be done manually.
- Group (Field/Unit/Platform) Level Calculations
- Gross or Net Summary Graphs
- Allocated revenues, expenses, taxes or investments between cases
- Group Ownership Reversions
- Dynamic date management – let PHDWin manage dates for investments, operations exepenses, forecast segments, and recompletions for you
- Recompletion Tree allows the easiest modeling and managing of recompletion cases where the economic limit of one zone controls the start date of the next.
- Managing and calculating true wedge (incremental) economics has never been easier.
Comprehensive U.S., Canadian, and international economics for both before and after income tax considerations are available.
Domestic tax regimes and international fiscal regimes can be modeled within a single database. Each case can be worked in its native units, currency, and economical model. At report time, a common currency and unit convention may be selected for individual and summary reports. All unit conventions and currency conversions are handled by PHDWin at report time.
Forecasting Tools
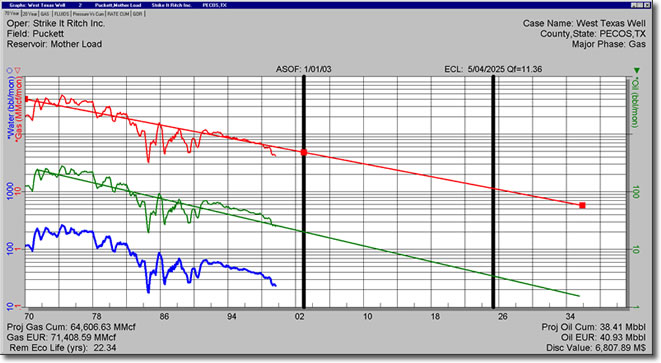
Our graphics module is unsurpassed in its ease-of-use and quality of output. Economic results are displayed immediately on a graph after any modification to either the forecast or economic variables.
PHDWin instantaneously displays the results of any economic or forecast change on any graph. Results such as cumulative discounted cash flow, estimated ultimate recovery, final economic limit date, cum production values, and important header data are dynamically displayed without re-running economics.
PHDWin graphics are the most robust and flexible while remaining easy-to-use. No other system offers more variety in editing decline curves and calculating estimated ultimate recovery. Here is a sampling of the options:
- Three auto fit options or direct curve parameter inputs
- Drag-and-drop projections or copy an analogous trend
- View multiple projections on a single graph
- Reconcile decline estimates with in-place volumes
- Project rate-time or rate-cum
Comprehensive U.S., Canadian and International economics for both before and after income tax considerations are available.
All fiscal regimes can be modeled within a single database. Each case can be worked in its native units, currency and economical model. At report time, a common currency and unit convention is selected for individual and summary reports, and all the conversions are handled by PHDWin on the fly. Yes, it really is that simple.
Need a regime built? TRC Consultants may be commissioned to build PSC, PSA and any other Regime. Click here for more information.
PHDWin allows for unsurpassed flexibility in customizing graph layouts. Choose up to six different products with 5 different forecasts for each product on a single graph. Select colors, line styles, and create annotations. These and other features allow concepts to be easily communicated visually.
The volumetric calculator is integrated with the decline curves to calculate in-place volumes and automatically display recovery factor percentages.
Project BHP/Z to calculate in-place gas volumes that are linked to the gas decline curve.
Estimate Reserves
Companies need to know how much they have already produced, how much is left to produce, and the total estimated economic recovery. PHDWin provides over 60 canned reports, including some reports that comply with both SEC and NI51-101 guidelines.
What-If Scenarios
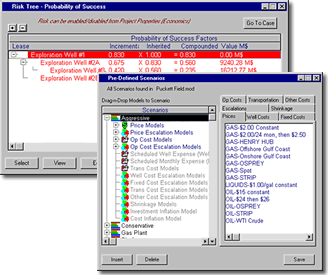 Our intuitive interface makes sensitivity analysis manageable and easy.
- Group prices, expenses, and taxes into scenarios to quickly and easily run sensitivity analysis
- Analyze incremental economics through easy to manage, automated case subtraction
- Risk analysis can be performed through the Risk Tree or through case or volume multipliers, or a combination of the three
Prospect Evaluation
- Use normalized data to create type curves
- Use the Prospect Generator to marry basic well data with type curves to create flexible drilling schedule
- Dynamic dates make moving drilling schedule easy and fast
- Economic scenarios allow for instant sensitivity analysis
International Economics
Comprehensive U.S., Canadian, and international economics for both before and after income tax considerations are available. We have modeled economics in over 40 countries/areas of the world. (See map.)
Domestic tax regimes and international fiscal regimes can be modeled within a single database. Each case can be worked in its native units, currency, and economical model. At report time, a common currency and unit convention may be selected for individual and summary reports. All unit conventions and currency conversions are handled by PHDWin at report time.
Report Results
Choose from one of 60 default report formats that come standard with the program. Roll-ups and summaries are easy to define and automate. Make informed business decisions based upon Net Present Value, Internal Rate of Return, and Return on Investment.
Position your company ahead in today’s fast-paced environment with easy and clear presentations of results. PHDWin offers the most sophisticated reporting in an easy to use interface. Success is easily achieved with features like:
- Over 60 default report templates included
- Supports all conventional economic indicators
- Cases input in different volume conventions and currencies can be reported in the currency and convention of choice
- Simple to control summaries and subtotals for even the most complicated reports
- Full Canadian NI 51-101 reporting supported
- Create custom MS Access Queries and Reports to run from PHDWin
- Full access to reporting database makes it easy to implement data visualization tools such as Rosetta PetroVisual
Click the images to below to view sample reports generated using PHDWin.

